
LOOKING FOR QUALITY OUTDOOR SPACE FOR OFFICE WORKERS in MIDTOWN MANHATTAN
We live in a world which is urbanizing at an unprecedented rate in both developing countries and traditional economic powers. If current trends persist, by 2013 New York City will have added 1.1 million residents for a gain of about 13.9 percent, with Manhattan estimated to grow over 18 percent. (nyc.gov, NY department of labor). This will result in a projected 40,000 jobs by 2020, which inevitably means more people working in downtown Manhattan. We are interested in investigating solutions to the stresses that come with high density urban working conditions. Specifically, we want to address the lack of quality relaxation environments for office workers in Midtown Manhattan.
Team: Diego Rodriguez, Vahe Markosian
Privately Owned Public Spaces (POPS) are incentivized through NYC zoning standards. They is also heavily regulated by these standards.
The large number of parameters set by the NYC Planning Department makes POPS design a perfect candidate for the use of data driven exploration.
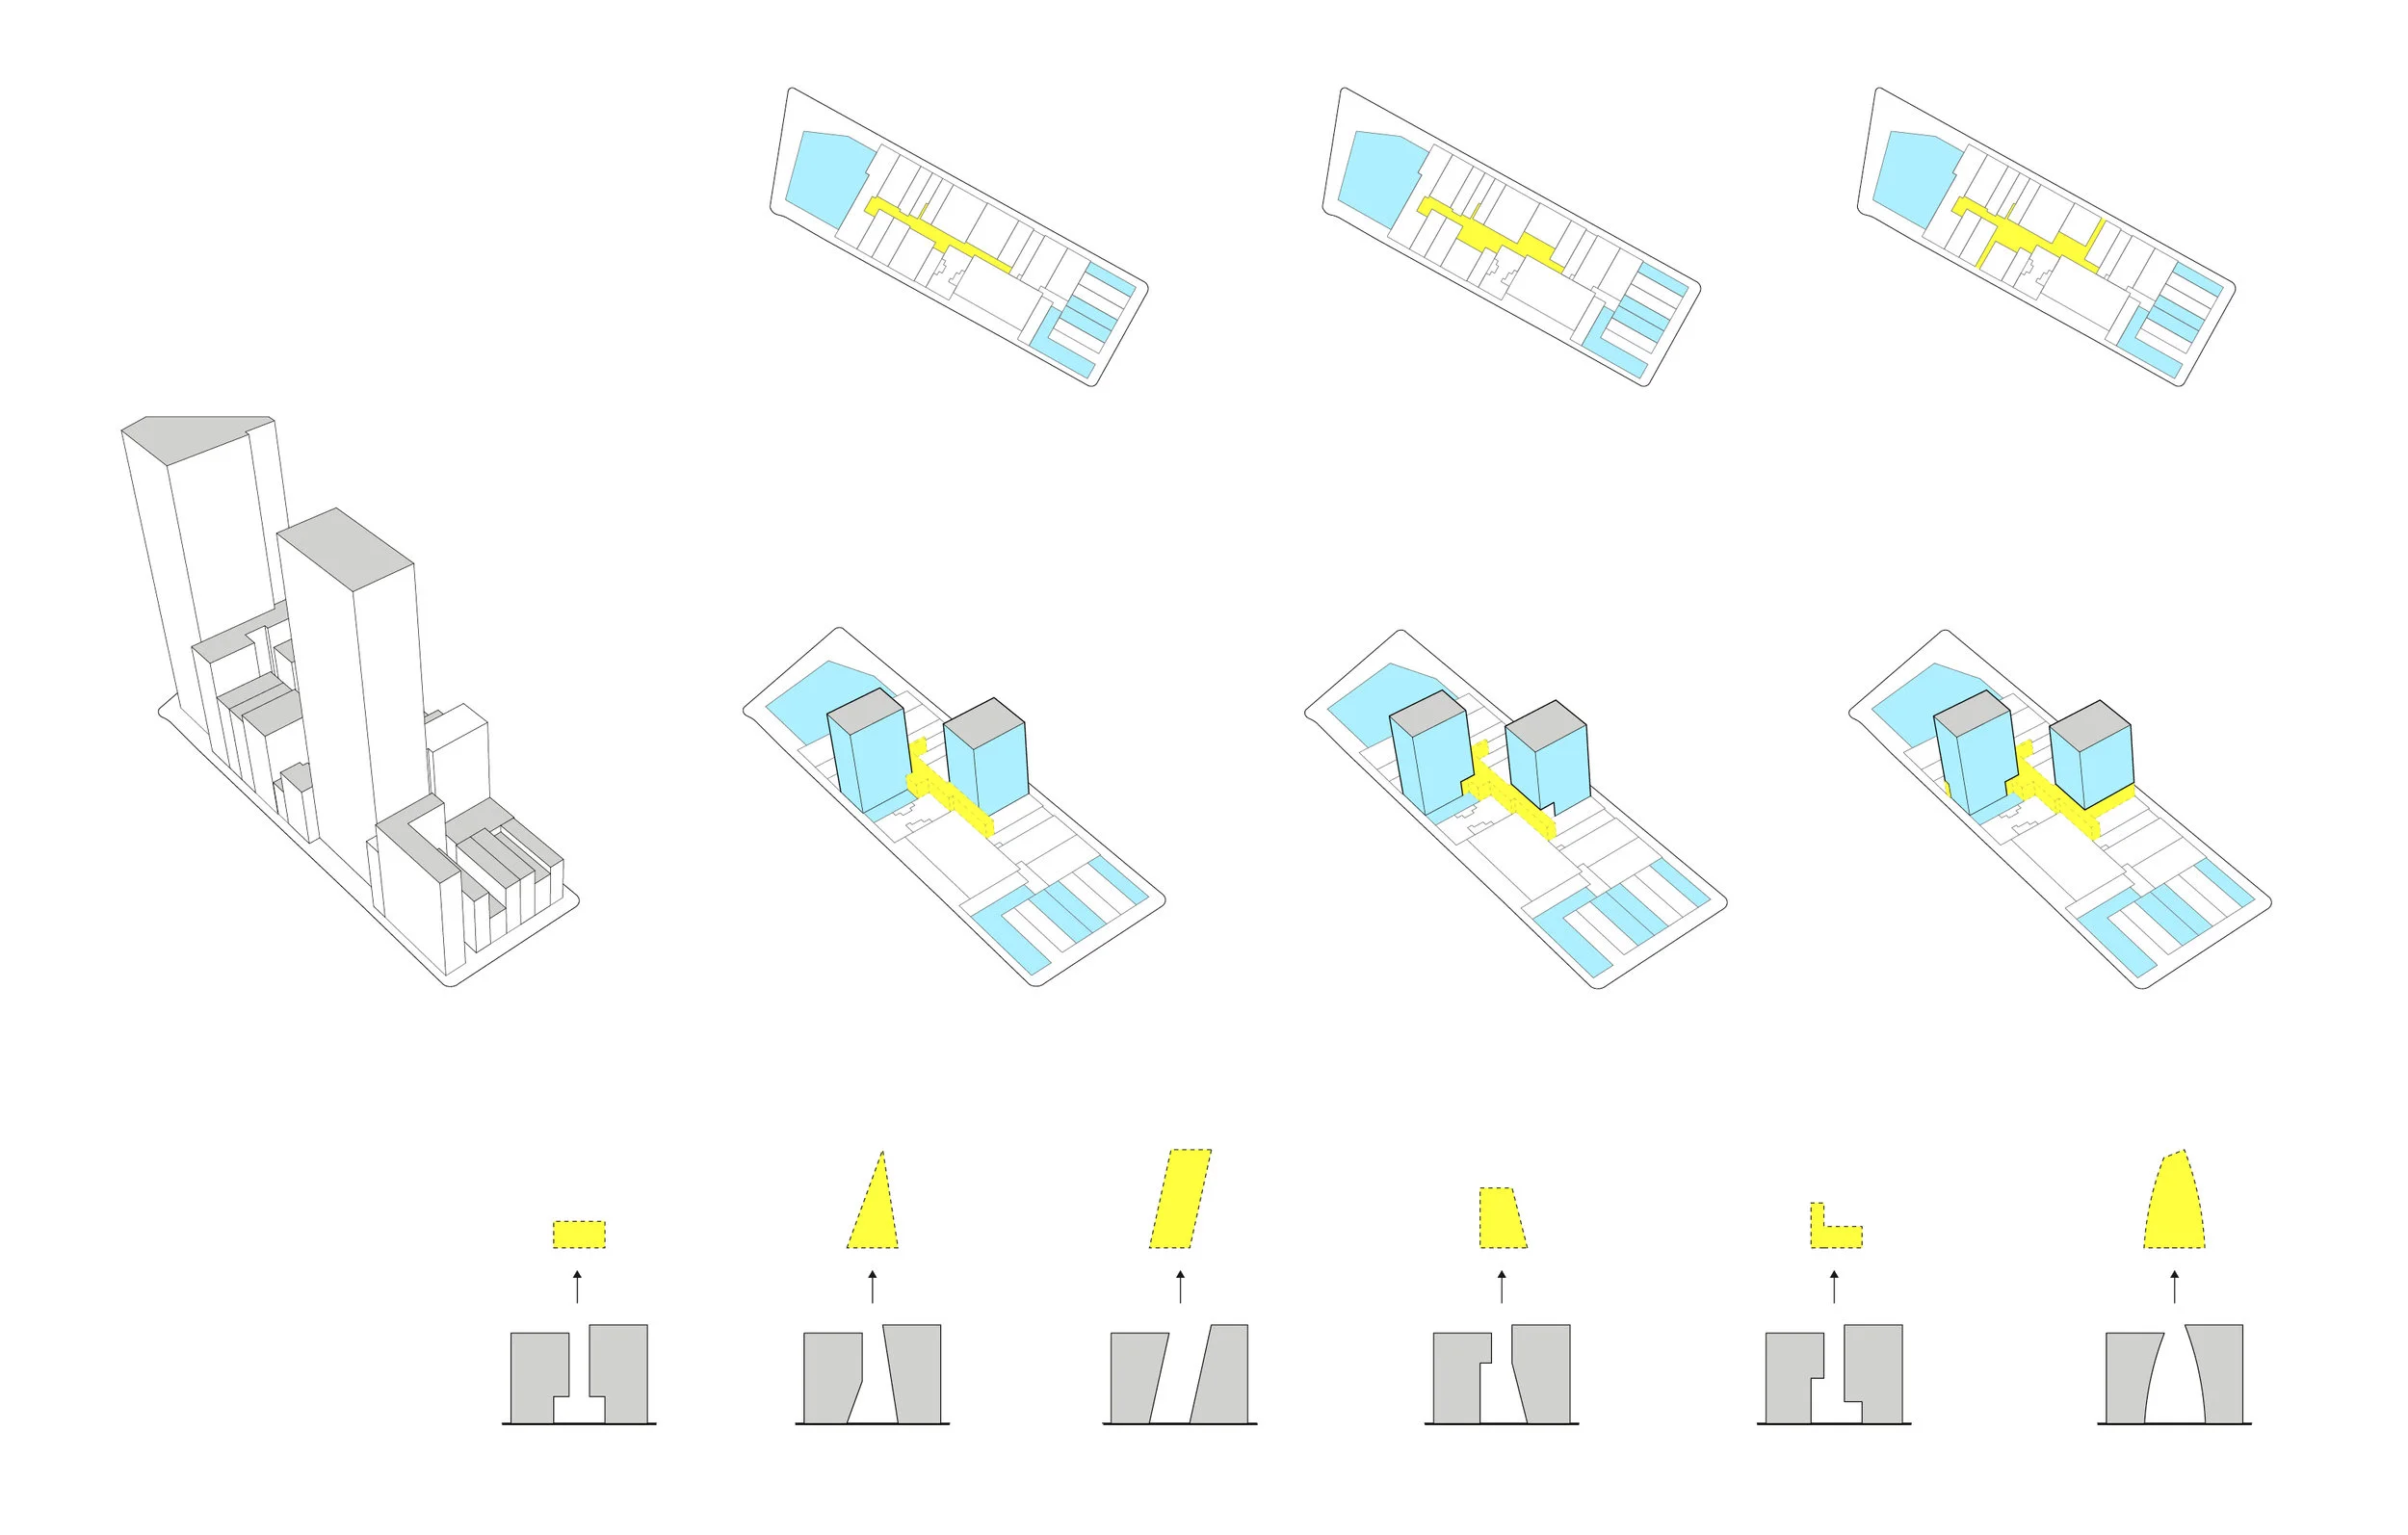
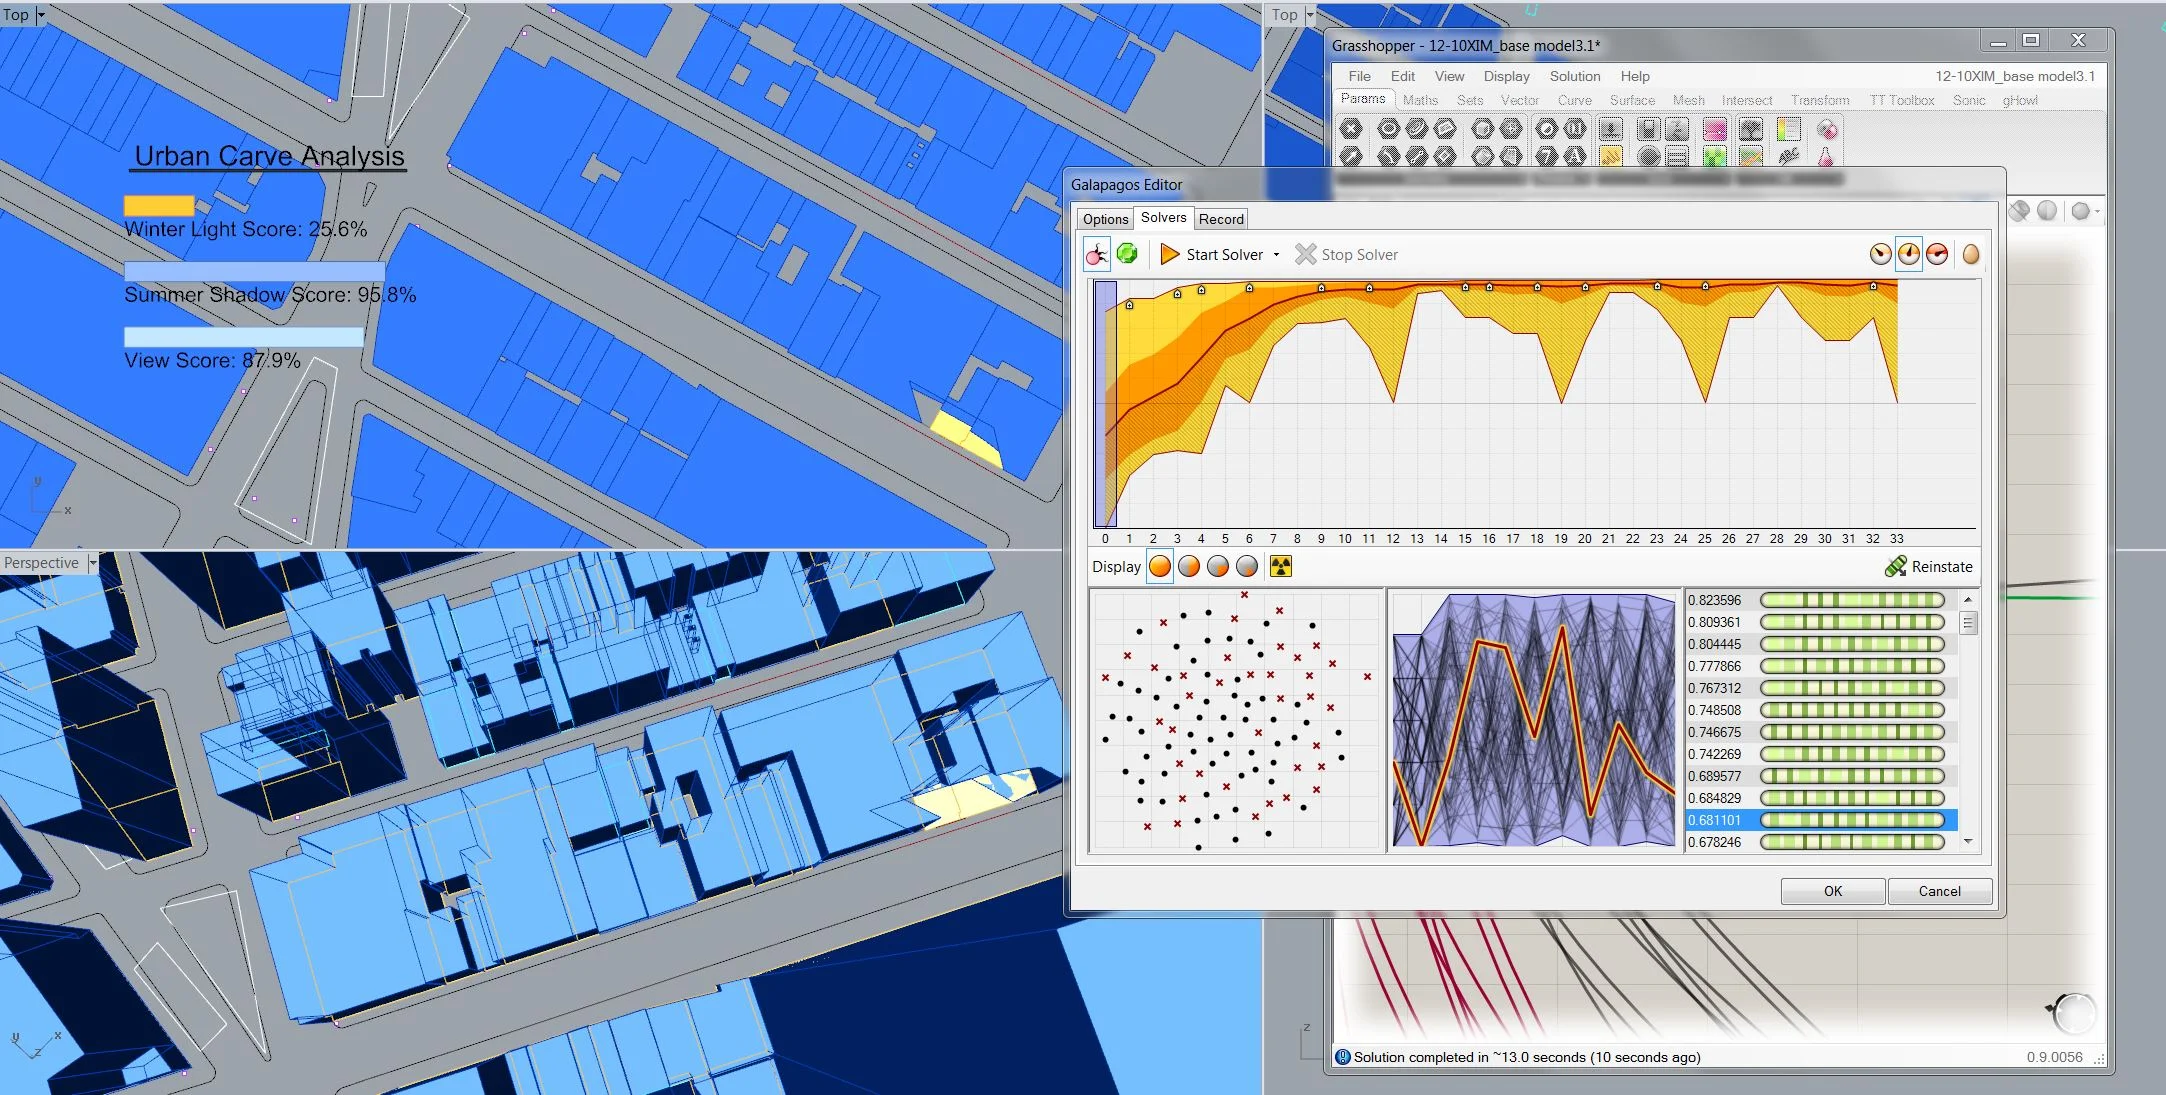
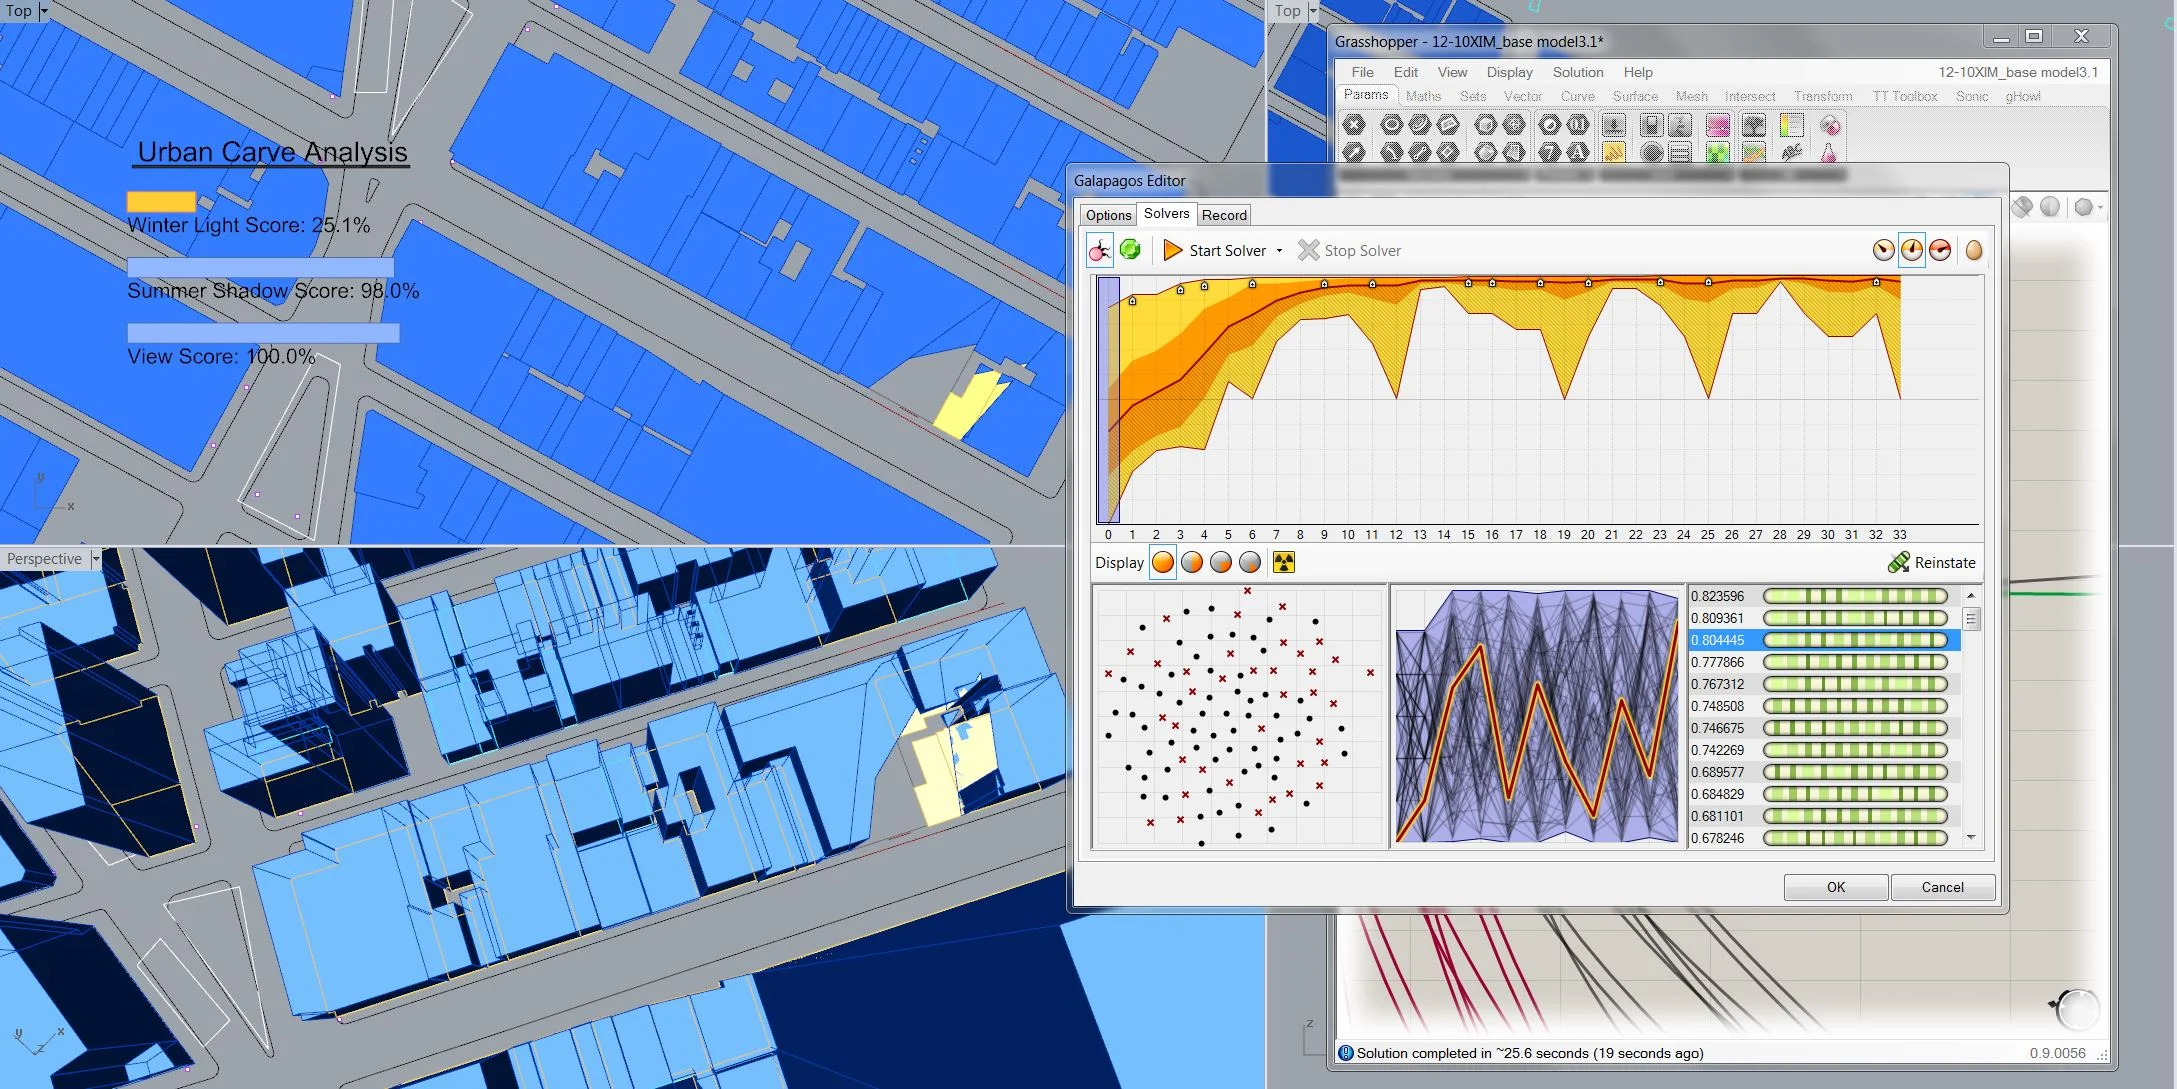
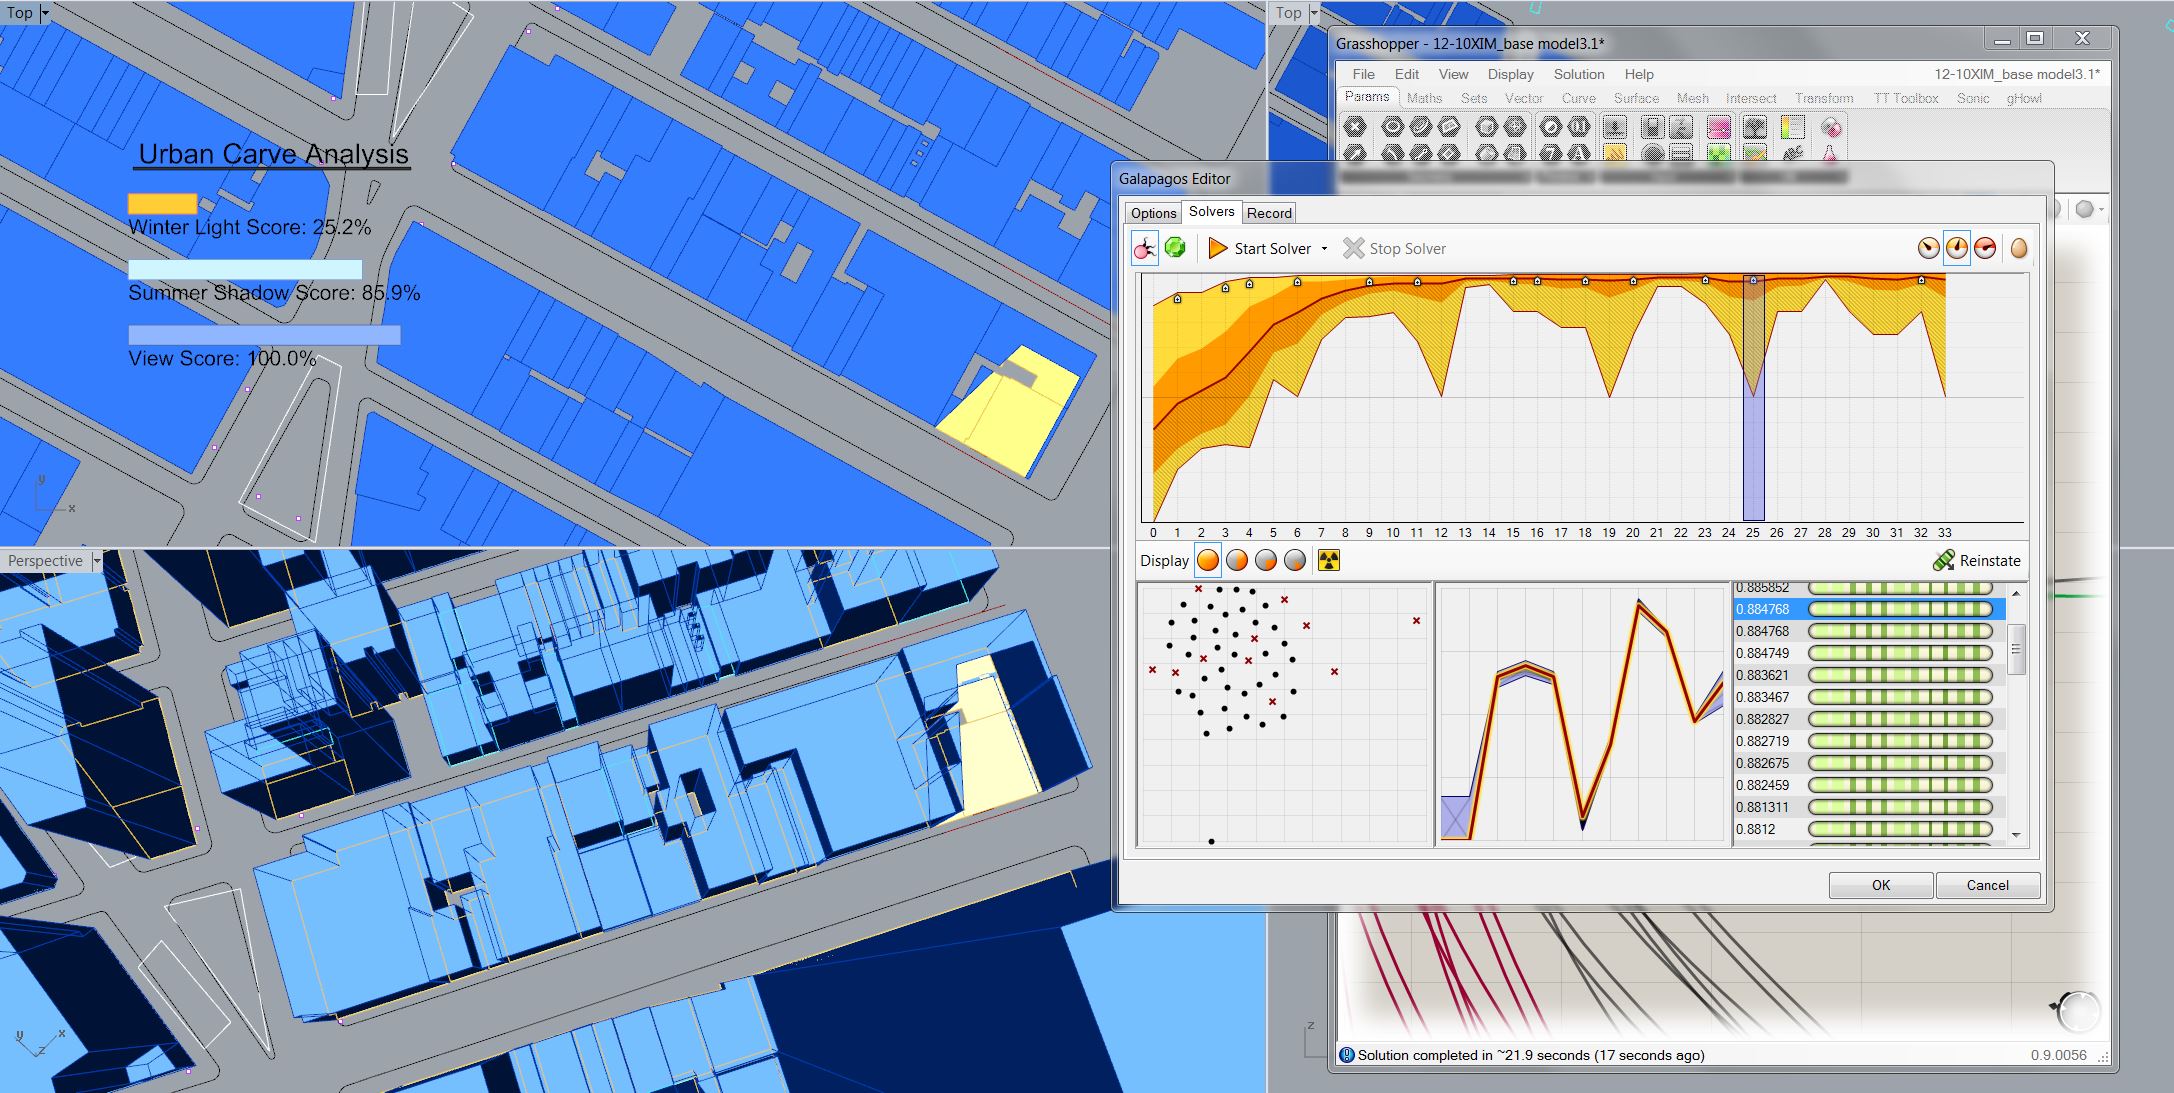
We chose a boolean subtraction as our theoretical physical intervention to generate a POPS, then used NYC Open Data + weather data in combination with Grasshopper - specifically the Galapagos Solver tool, to search for optimal ways to deploy our physical intervention.
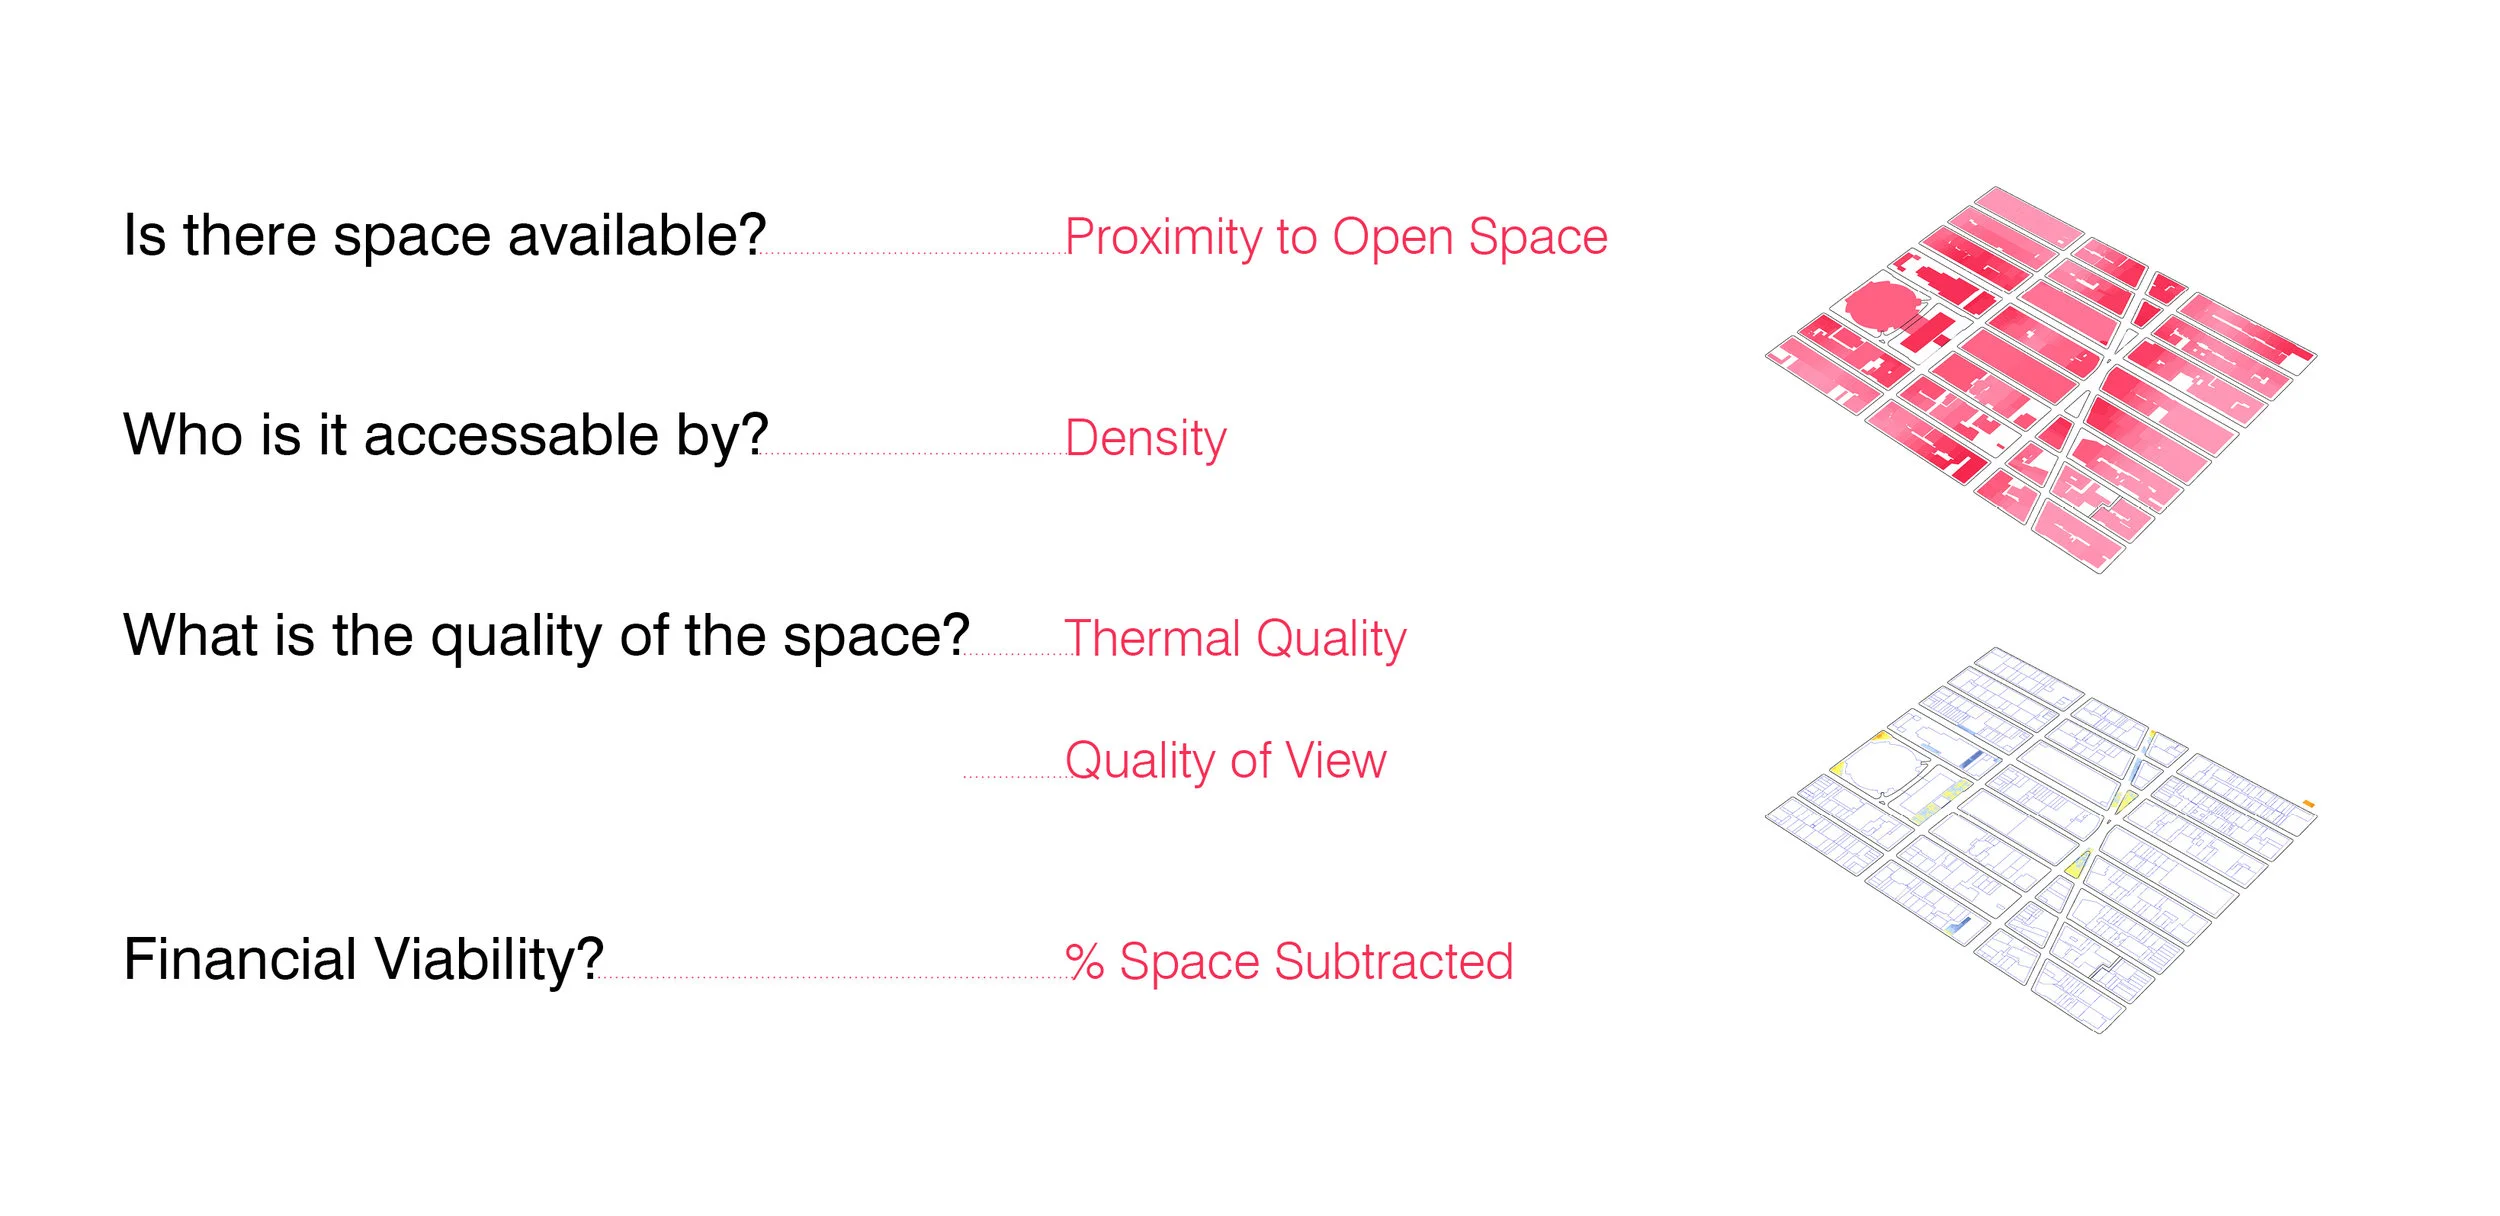
List of Proposed Performance Metrics
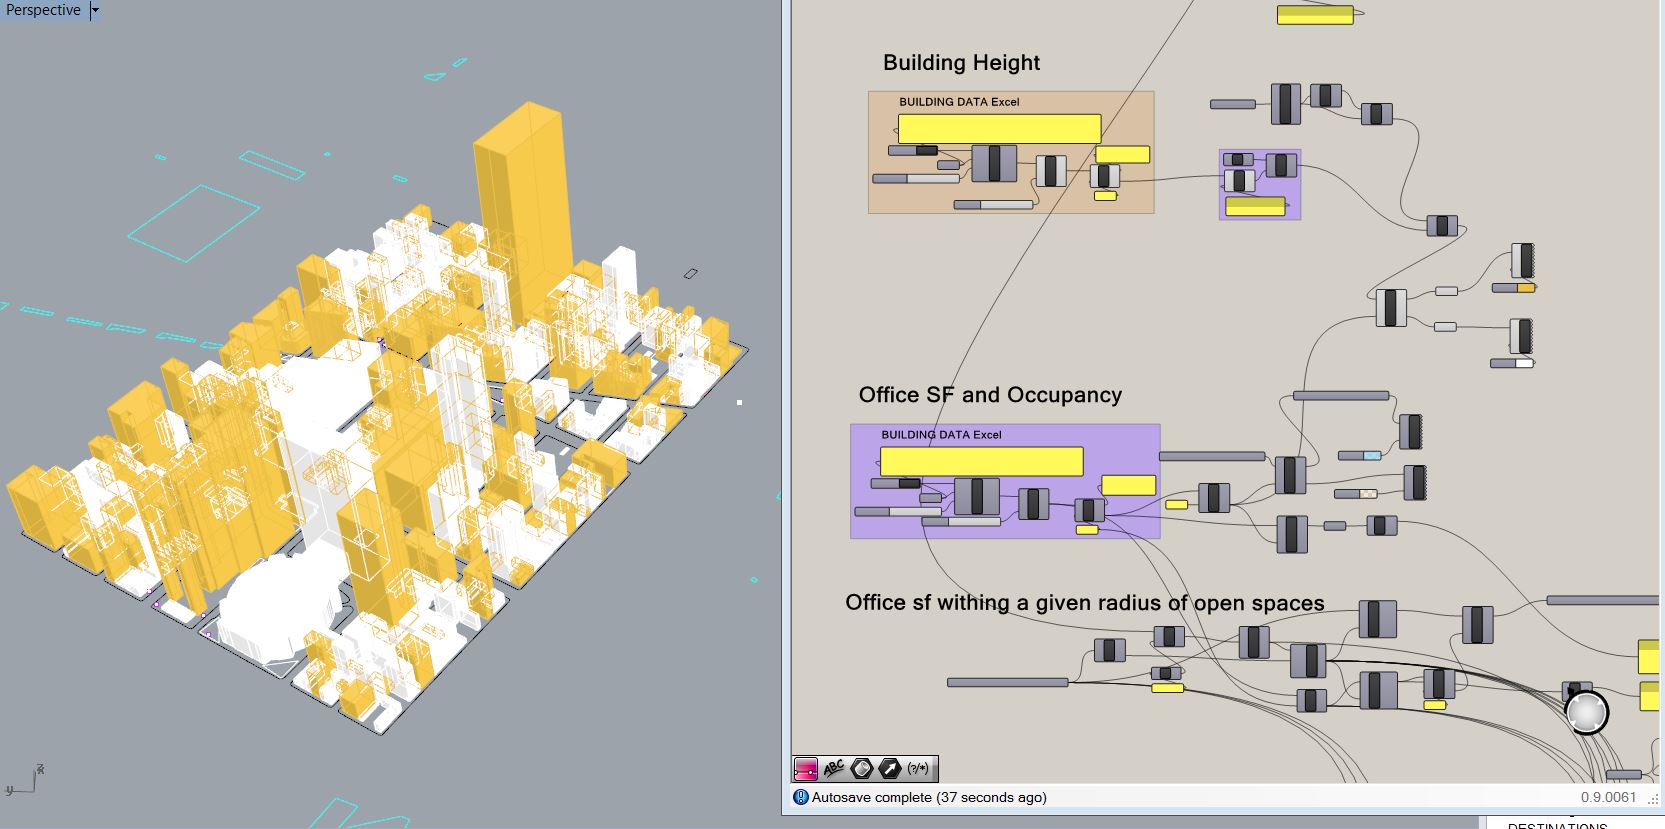
Density of Office Employees
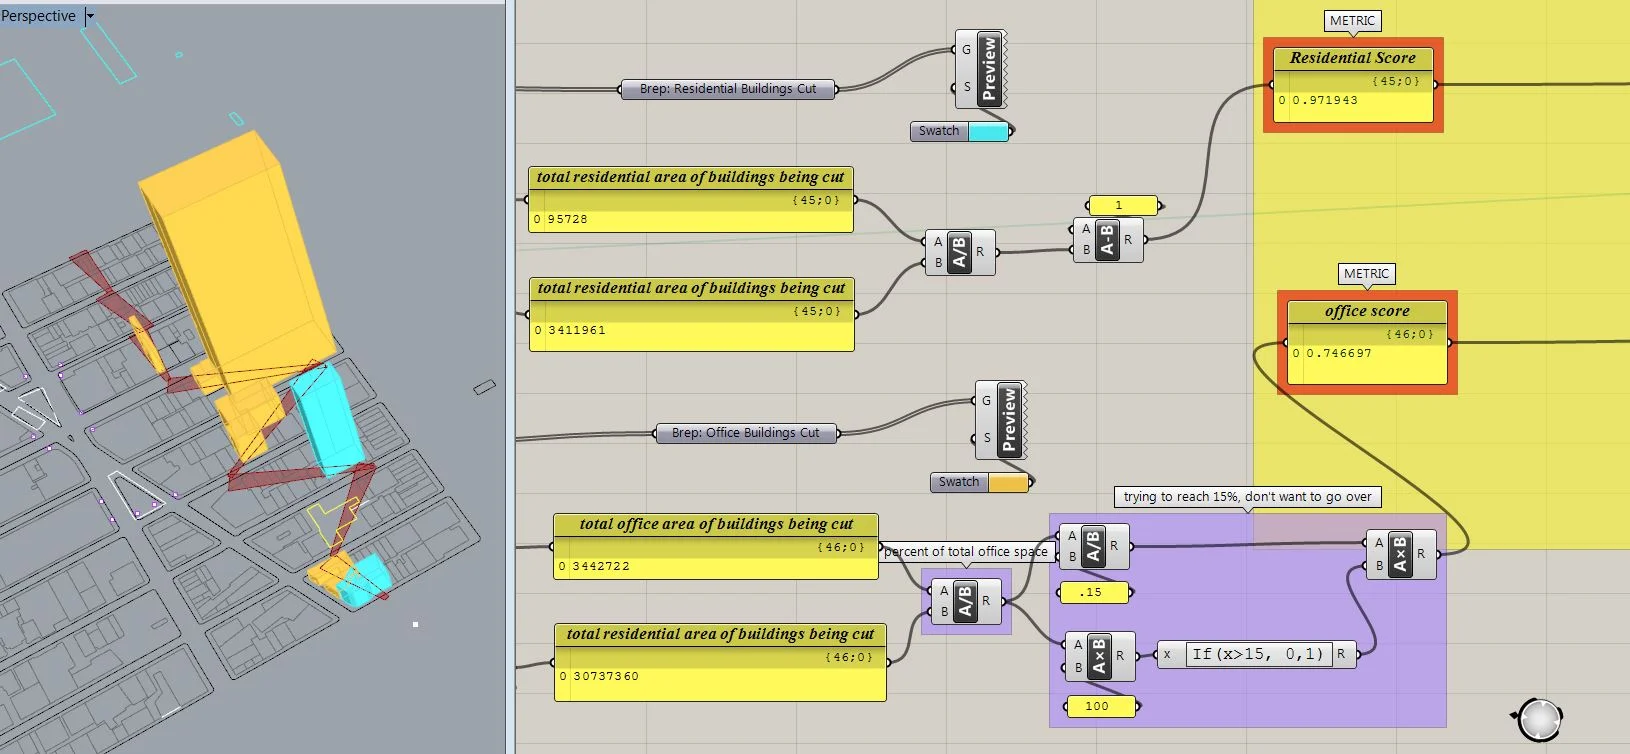
Residential vs. Office Space - residential cuts were set to yield extremely bad scores for the model in order to avoid making them
According to Leigh Stringer the director of Innovation Research at HOK Washington DC, there is a list of ten factors that directly affect employee satisfaction in an office environment.
1. Thermal Comfort and Temperature
2. Access to Nature, Views and Daylight
3. Sensory Change and Variability
4. Color
5. Noise Control
6. Crowding
7. Human Factors and Ergonomics
8. Indoor Air Quality
9. Choice
10. Employee engagement
We proposed that at least five out of these ten can be addressed through providing access to high quality outdoor relaxation and work spaces.

View Rating - Quality and Visibility
In Article 3 Chapter 7 on NYC Zoning Regulations it states that for privately owned public spaces the majority of the space must be visible from the adjacent street. This metric is calculated by subdividing the cut zone into sections and computing the visibility of these sections from sample points on the street.

Summertime Shade Rating

Wintertime Sun Rating
People will not go outside to relax if there isn’t a reasonable level of thermal comfort so we found it important to use both sunlight during the winter and shade during the summer as metrics for outdoor public spaces. Moreover since we are specifically dealing with issue of office breaks, we looked at the sun specifically during the hours of 12pm - 3pm.
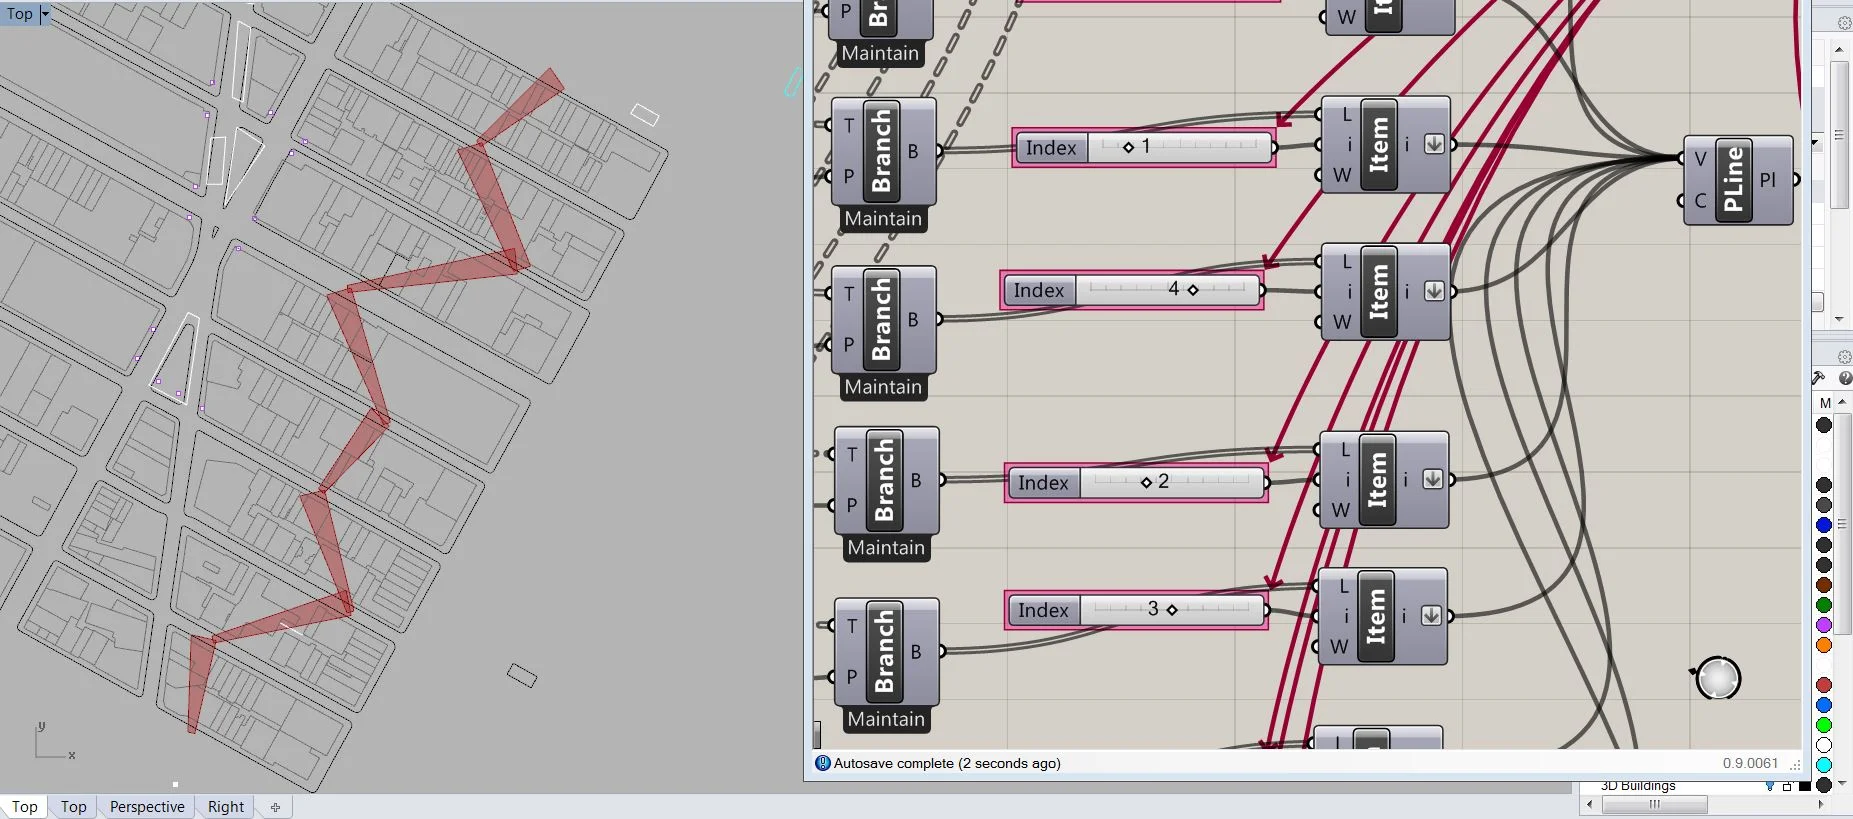
Initially we were trying to create a through block pathway linking office buildings together, so we set our parameters so out interventions to each block were necessarily linked.
The intervention was limited to a max percentage (in this case 15%) of total ground floor office space removed where if it goes above that number, the program will return drastically bad scores. Additionally cuts of residential buildings also reduce the overall score, discouraging it to place


EVOLUTION SET 1 CONCLUSIONS
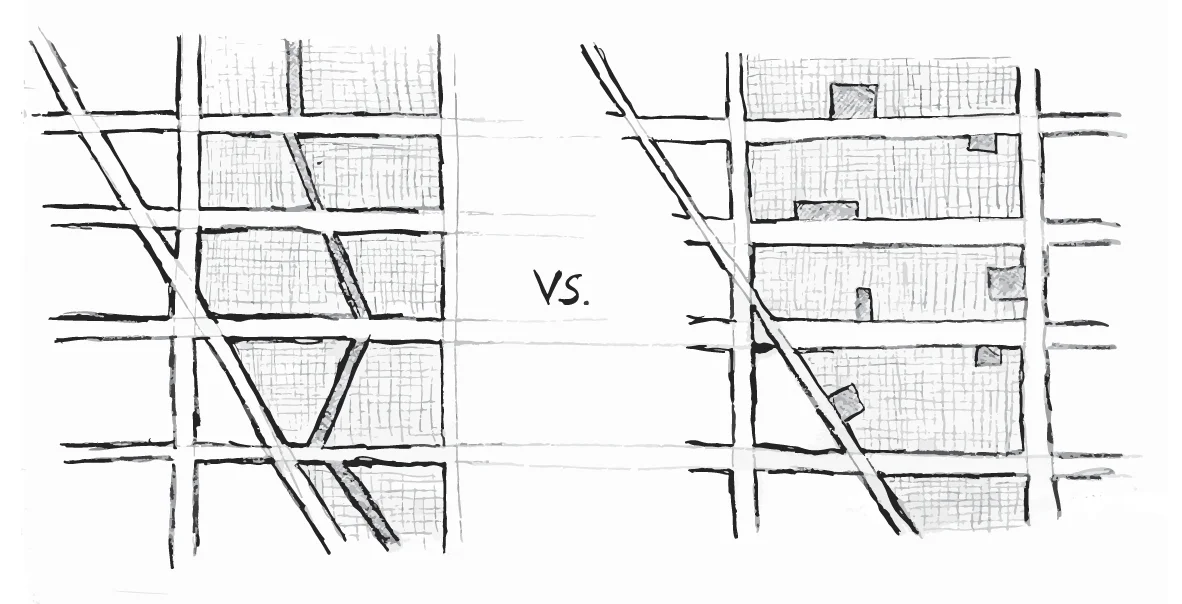
Though we were getting interesting cuts in the beginning the system soon figured out it could maximize the environmental rating and pushed the entire intervention towards the far edge of the block. This was an oversight in our model because we could have included the adjacent buildings in our sun/shadow data even though they were not part of our direct intervention.
Also we realized that the constraints we had given ourselves of making all cuts adjacent was working against us because we were cutting valuable real-estate and residential buildings were limiting the scope of our interventions.
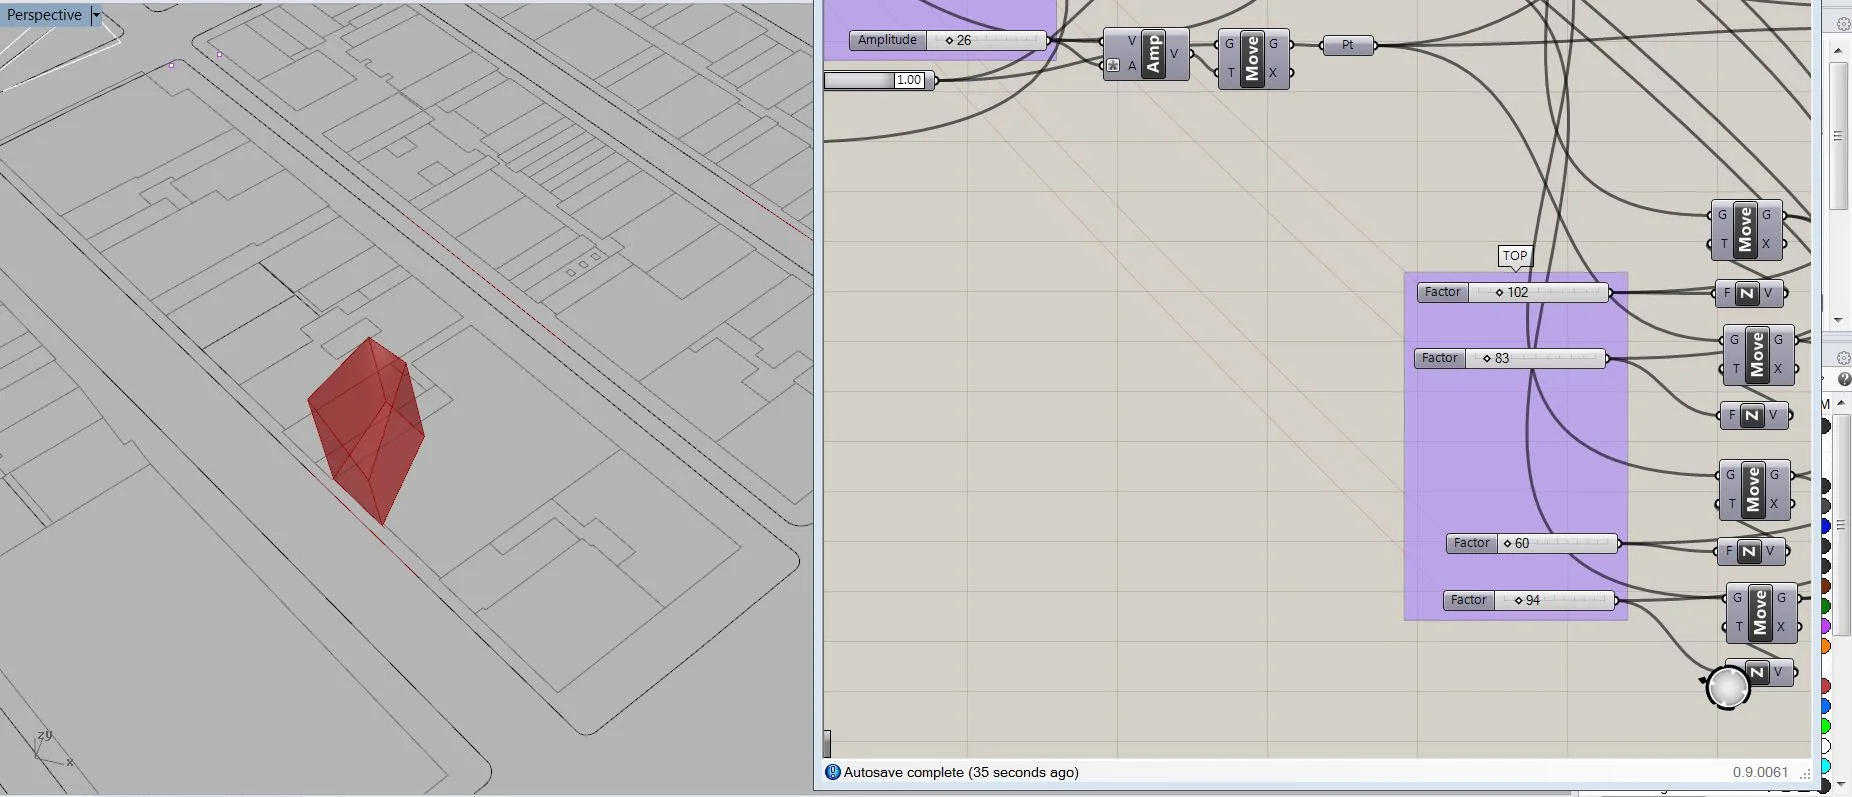
Cut Module Version 2
We created a new cut module which could move around a single block. The goal was to link multiple modules together in one Galapagos session or through overall metrics. Though the module is cutting a single block, its metrics are still being compared to complete site numbers.
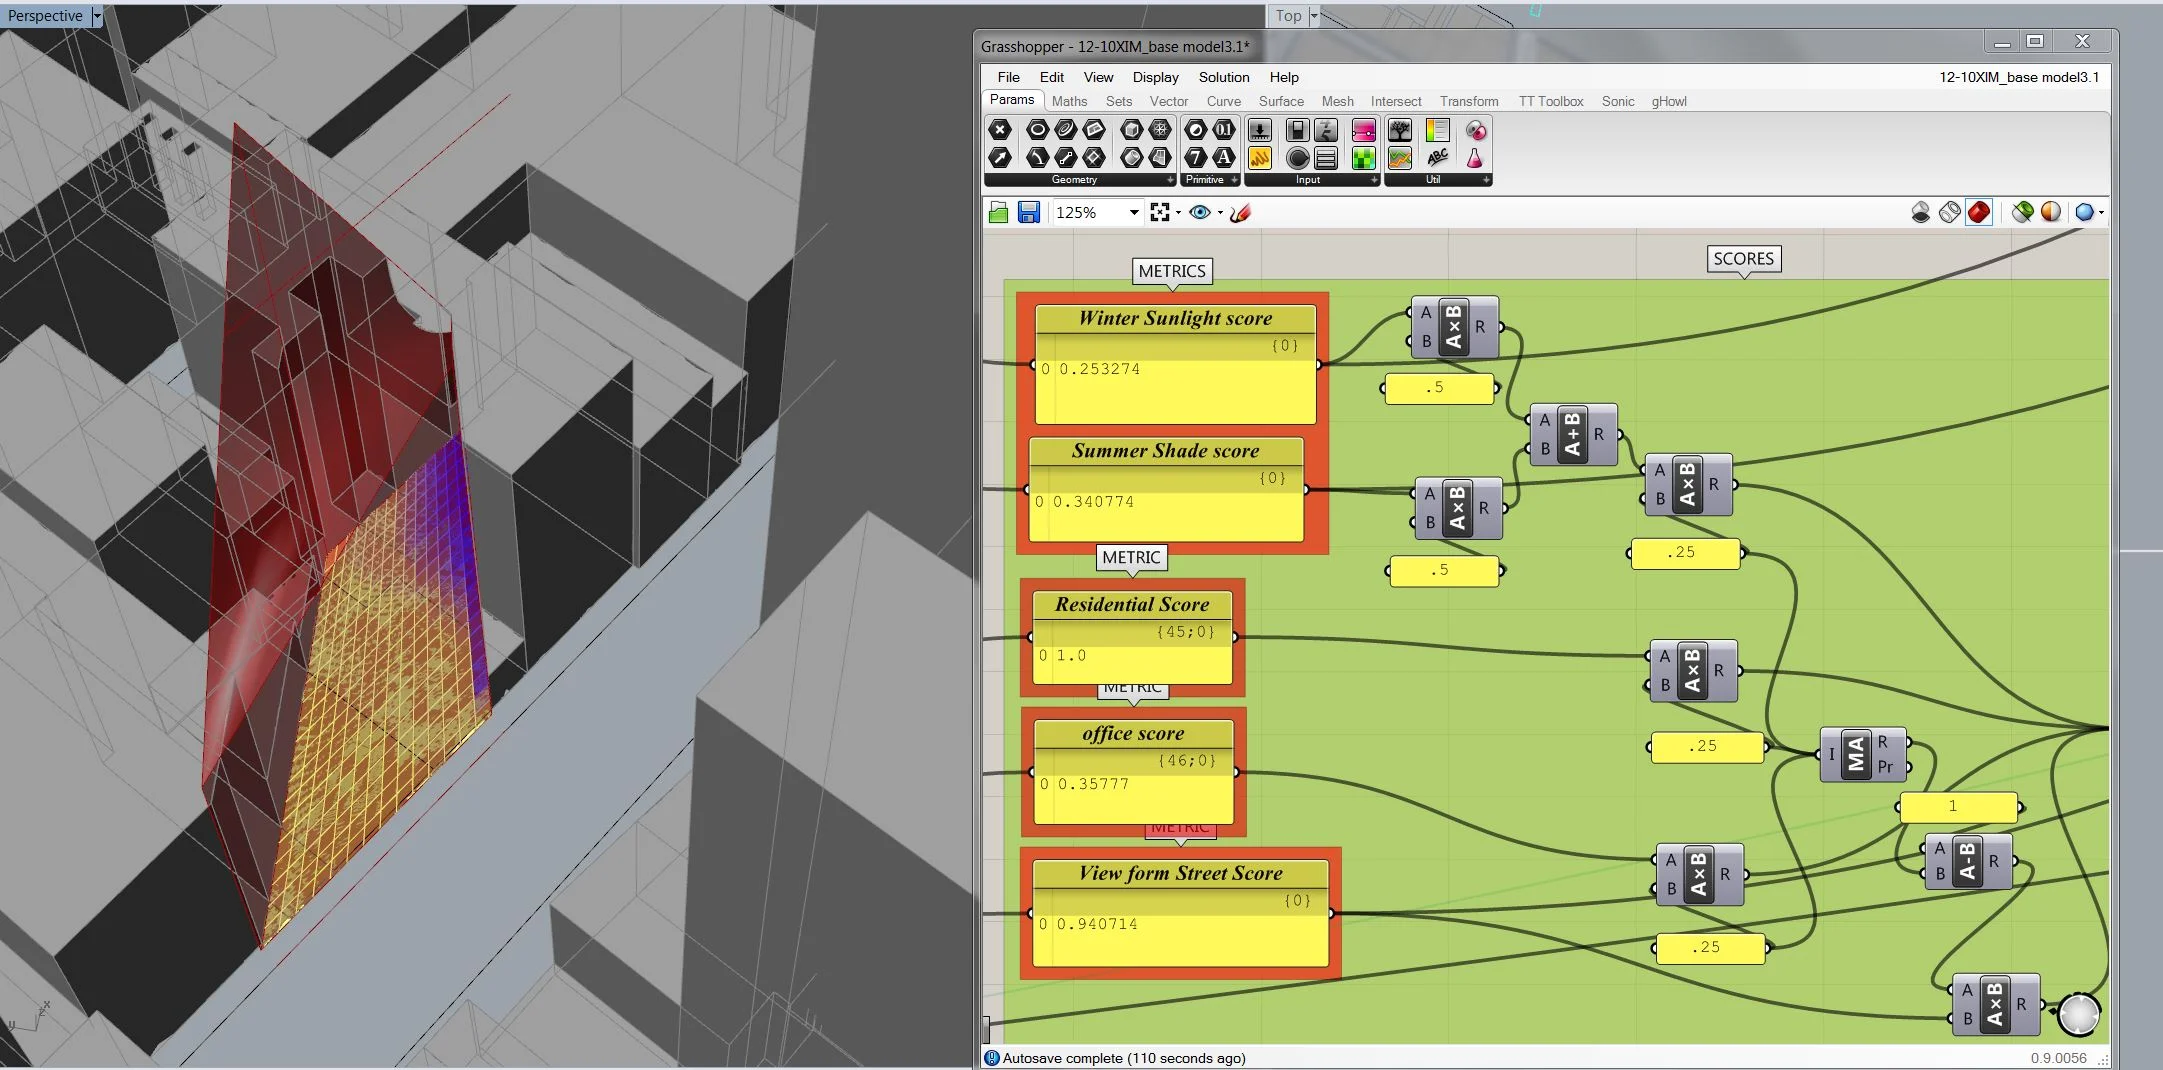
Environmental Metrics on Surfaces Adjacent to Cut Module
Additionally we pushed our concept of thermal/environmental concept one step further by taking the surfaces on buildings affected by our cut module, assuming they would be glass, and giving them a sunlight score – setting the model to maximize sunlight


Evolution Set 2 conclusions
This time we had corrected for the effect adjacent (non-chosen area) buildings would have on our environmental score. However, our model ended up choosing a shape on the south-east side of our chosen building set, and making a very large cut, which should have been limited by the weights we had given our parameters. Our semester ended before we could push our exploration further…
study conclusions
Our assumptions going in to this study were that we could build a model with clear inputs which — given carefully calibrated output metrics — would yield the optimal places to make small boolean interventions into blocks, in order to create useful outdoor spaces for the occupants of our chosen area. After months of data mining, calibration, and testing we concluded that the human decision making factor is much more critical than we initially suspected. Instead of trying to create the most complete model to give you the solution directly, it is much more effective to set up simple models to test individual metrics, and then as the designer use this information to make informed decisions.